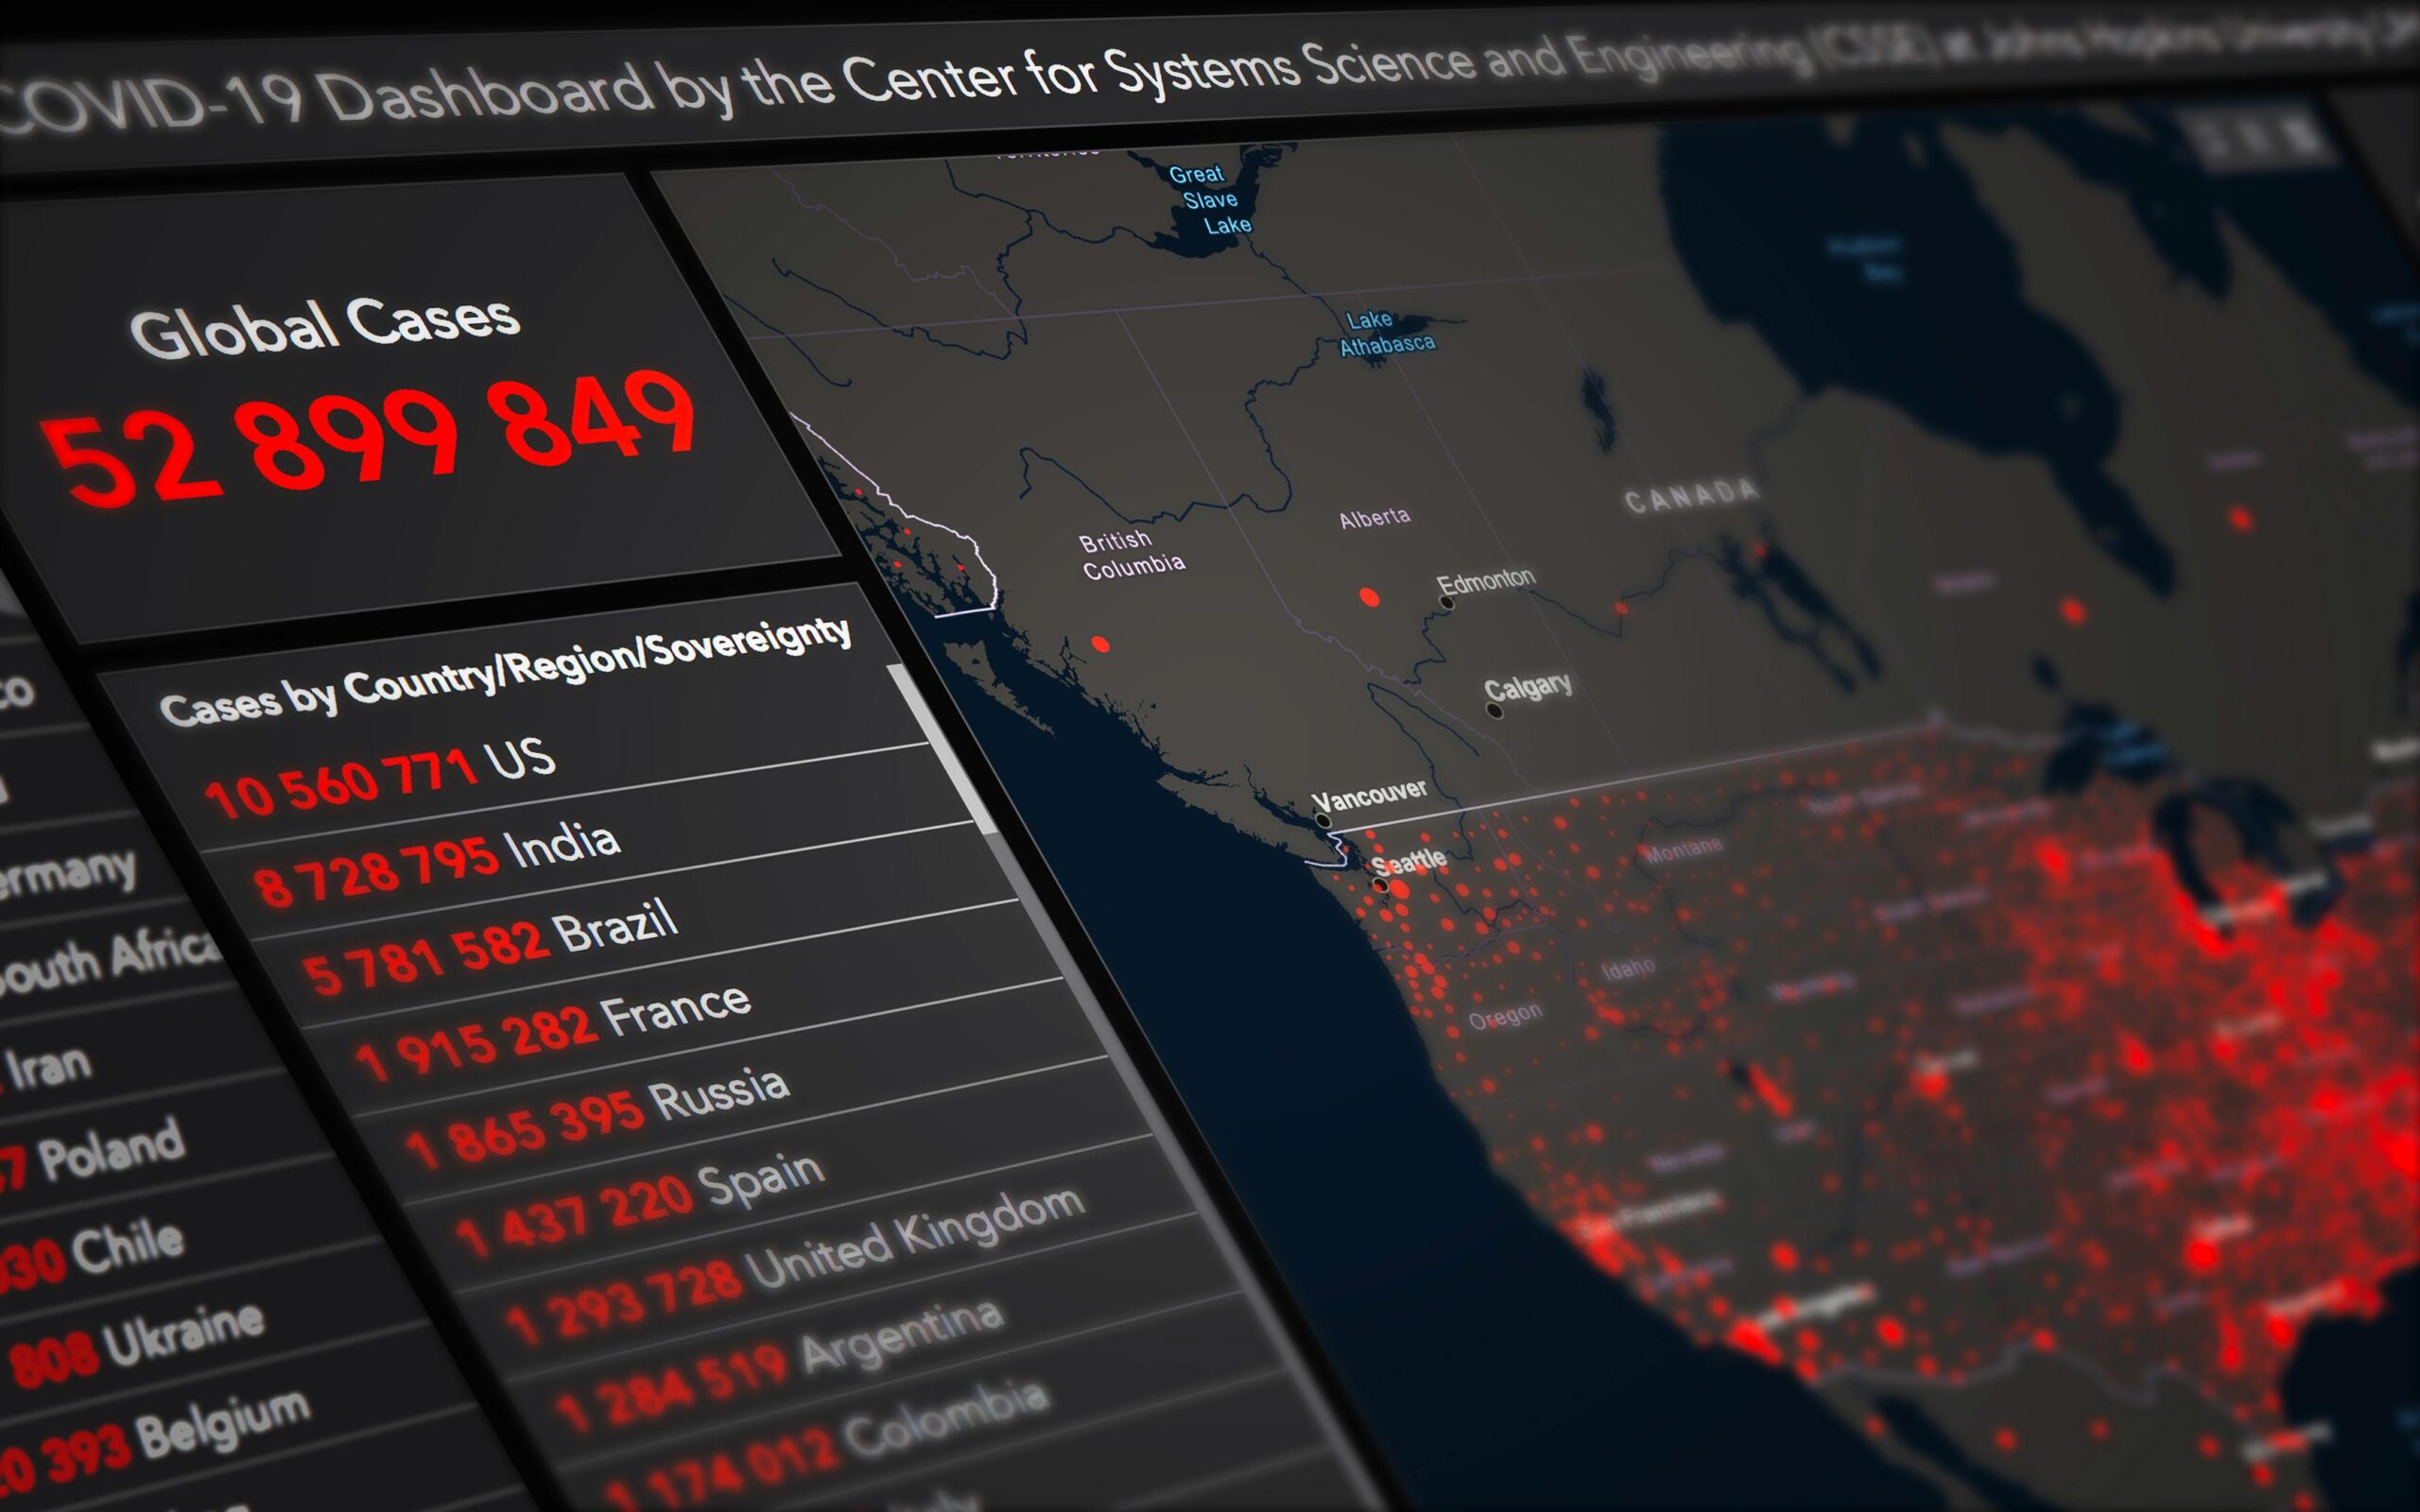
Real-time dashboards transform sensor-based projects by delivering instant data insights that empower teams to make faster, smarter decisions and optimize operational efficiency.
🚀 The Revolutionary Impact of Real-Time Data Visualization
In today’s fast-paced technological landscape, sensor-based projects generate massive volumes of data every second. Without proper visualization tools, this valuable information remains trapped in databases, unable to drive meaningful action. Real-time dashboards bridge this critical gap by transforming raw sensor data into actionable intelligence that decision-makers can immediately understand and act upon.
Organizations across industries are discovering that the difference between reactive and proactive operations lies in how quickly they can access and interpret sensor data. Manufacturing plants monitor equipment temperature and vibration patterns to prevent costly breakdowns. Smart cities track traffic flow and air quality to improve urban living conditions. Agriculture operations measure soil moisture and weather conditions to optimize crop yields. The common thread? Real-time dashboards that present complex data streams in intuitive, visual formats.
📊 Understanding the Core Components of Effective Sensor Dashboards
Building an effective real-time dashboard requires careful consideration of several fundamental elements that work together to deliver meaningful insights. The architecture must support continuous data streaming while maintaining system performance and reliability.
Data Collection and Integration Layer
The foundation of any sensor dashboard begins with robust data collection mechanisms. IoT sensors continuously transmit readings through various protocols including MQTT, HTTP, and CoAP. These data streams must be efficiently captured, validated, and routed to appropriate processing systems. Modern dashboards integrate seamlessly with diverse sensor types—temperature probes, motion detectors, pressure gauges, GPS trackers, and environmental monitors—creating a unified data ecosystem.
Edge computing capabilities have become increasingly important in this layer. Processing data closer to the sensor source reduces latency and bandwidth requirements while enabling faster response times. This approach is particularly valuable for projects requiring immediate alerts or automated responses based on sensor readings.
Data Processing and Analytics Engine
Raw sensor data rarely provides direct value without proper processing. The analytics engine applies algorithms to filter noise, identify patterns, detect anomalies, and calculate derived metrics. Time-series databases optimize storage and retrieval of sensor readings, enabling both real-time monitoring and historical analysis.
Machine learning models enhance dashboard capabilities by predicting future trends, identifying subtle correlations between different sensor readings, and automatically flagging unusual patterns that might indicate problems. These intelligent systems learn from historical data to continuously improve their accuracy and relevance.
Visualization and User Interface
The dashboard interface translates complex data into visual representations that humans can quickly comprehend. Effective visualizations include line charts for tracking trends over time, gauge displays for current readings against thresholds, heat maps for spatial data distribution, and geographic maps for location-aware sensors.
Customization options allow different users to create personalized views focused on their specific responsibilities. A maintenance technician might prioritize equipment health indicators, while an executive focuses on high-level performance metrics and cost savings.
💡 Key Benefits Driving Dashboard Adoption
Organizations investing in real-time sensor dashboards consistently report measurable improvements across multiple operational dimensions. These benefits extend far beyond simple data visualization to fundamentally transform how teams work and make decisions.
Immediate Problem Detection and Response
Traditional monitoring approaches involve periodic manual checks or scheduled reports that might reveal problems hours or days after they occur. Real-time dashboards eliminate this delay by instantly displaying current conditions and triggering alerts when readings exceed predefined thresholds. This immediate awareness enables rapid response that can prevent minor issues from escalating into major failures.
Consider a data center monitoring server temperatures. A real-time dashboard detecting rising temperatures can automatically alert technicians and trigger cooling system adjustments before equipment damage occurs. The financial impact of preventing even a single server failure easily justifies the dashboard investment.
Enhanced Operational Efficiency
Visibility into real-time operations reveals inefficiencies and optimization opportunities that remain hidden in aggregated reports. Manufacturing dashboards showing machine cycle times help identify bottlenecks and balance production lines. Energy management dashboards displaying consumption patterns enable load shifting to reduce costs during peak rate periods.
Teams equipped with instant data insights spend less time gathering information and more time acting on it. Decision cycles compress from days to minutes as stakeholders access the same real-time view of operations without waiting for report generation or data reconciliation.
Data-Driven Culture Development
Real-time dashboards democratize data access across organizations. When everyone from frontline operators to senior executives can view current performance metrics, data becomes a common language for discussion and collaboration. This transparency fosters accountability and encourages continuous improvement mindsets.
Teams begin asking better questions when data is readily available. Rather than debating what might be happening, conversations focus on why patterns occur and how to improve outcomes. This cultural shift toward evidence-based decision making creates lasting competitive advantages.
🔧 Implementation Strategies for Maximum Impact
Successfully deploying real-time sensor dashboards requires thoughtful planning and execution. Organizations that approach implementation strategically achieve faster time-to-value and higher user adoption rates.
Start with Clear Objectives
Define specific goals before designing dashboard interfaces. Are you primarily focused on reducing downtime, improving energy efficiency, enhancing product quality, or ensuring safety compliance? Clear objectives guide decisions about which sensors to deploy, what metrics to calculate, and how to structure visualizations.
Engage stakeholders from different departments to understand their unique information needs. Operations teams might need detailed technical metrics while executives prefer summarized KPIs. A well-designed dashboard system accommodates multiple user personas without creating overwhelming complexity.
Choose the Right Technology Stack
Technology choices significantly impact dashboard performance, scalability, and maintenance requirements. Consider factors including expected data volume, number of concurrent users, integration requirements with existing systems, and available technical expertise.
Cloud-based platforms offer rapid deployment and scalability advantages. Solutions like AWS IoT, Microsoft Azure IoT Hub, and Google Cloud IoT provide managed services that handle infrastructure complexity. Open-source alternatives such as Grafana, Node-RED, and InfluxDB offer flexibility and customization for organizations with development resources.
Prioritize Data Security and Privacy
Sensor data often contains sensitive information about operations, locations, or personal activities. Implement robust security measures including encrypted data transmission, role-based access controls, secure authentication mechanisms, and regular security audits. Compliance with regulations like GDPR, HIPAA, or industry-specific standards must be built into dashboard architecture from the beginning.
Design for Scalability
Successful pilot projects often expand rapidly as users recognize value. Design systems to accommodate growth in sensor counts, data volume, and user numbers without requiring complete rebuilds. Modular architectures allow incremental expansion while microservices approaches enable independent scaling of different system components.
📱 Mobile Access: Bringing Insights Anywhere
Mobile-responsive dashboards extend real-time insights beyond desktop computers to smartphones and tablets. This accessibility proves invaluable for field technicians, remote supervisors, and executives who need operational awareness while away from their desks.
Mobile interfaces require thoughtful design that adapts complex dashboards to smaller screens without sacrificing functionality. Priority information should be immediately visible while secondary details remain accessible through intuitive navigation. Push notifications alert users to critical conditions even when they’re not actively viewing the dashboard.
Native mobile applications can leverage device capabilities like GPS, cameras, and voice input to enhance functionality. A technician responding to an equipment alert can view relevant sensor data, capture photos for documentation, and update work orders—all within a unified mobile experience.
🎯 Industry-Specific Applications Demonstrating Value
Real-time sensor dashboards deliver transformative results across diverse industries, each leveraging instant data insights to address unique operational challenges.
Manufacturing and Industrial Operations
Factories deploy extensive sensor networks monitoring machine performance, environmental conditions, and production quality. Dashboards integrate readings from vibration sensors, temperature probes, power monitors, and vision systems to provide comprehensive equipment health visibility. Predictive maintenance algorithms analyze patterns to schedule interventions before failures occur, dramatically reducing unplanned downtime.
Smart Building Management
Commercial buildings use sensor dashboards to optimize HVAC systems, lighting, occupancy management, and security. Real-time energy consumption displays identify waste and verify efficiency improvements. Integration with weather forecasts enables proactive adjustments that maintain comfort while minimizing utility costs. Building managers monitor air quality sensors to ensure healthy indoor environments.
Agriculture and Environmental Monitoring
Precision agriculture relies on soil moisture sensors, weather stations, and crop health monitors to optimize irrigation, fertilization, and pest management. Farmers access real-time dashboards showing field conditions across large properties, enabling targeted interventions that conserve resources while maximizing yields. Environmental projects track water quality, air pollution, and wildlife activity through distributed sensor networks.
Healthcare and Patient Monitoring
Medical facilities use sensor dashboards to monitor patient vital signs, equipment status, and environmental conditions. Real-time alerts enable rapid response to deteriorating patient conditions or equipment malfunctions. Remote patient monitoring extends care beyond hospital walls by tracking chronic condition indicators through wearable sensors and home monitoring devices.
⚡ Overcoming Common Implementation Challenges
Despite clear benefits, organizations often encounter obstacles when deploying real-time sensor dashboards. Recognizing these challenges enables proactive mitigation strategies.
Data Quality and Reliability Issues
Sensor malfunctions, communication disruptions, and calibration drift can introduce erroneous data that undermines dashboard credibility. Implement validation algorithms that detect outliers and flag suspicious readings. Redundant sensors for critical measurements provide backup when primary devices fail. Regular calibration schedules maintain measurement accuracy over time.
Information Overload
Comprehensive sensor coverage generates enormous data volumes that can overwhelm users. Effective dashboards filter noise and highlight actionable insights rather than displaying every available metric. Intelligent alerting systems use context-aware rules to minimize false alarms while ensuring critical notifications reach appropriate personnel.
Integration with Legacy Systems
Existing operational technology often lacks modern connectivity features. Protocol converters and edge gateways bridge gaps between legacy equipment and contemporary dashboard platforms. APIs enable data exchange with enterprise systems including ERP, CMMS, and business intelligence tools.
User Adoption and Training
Sophisticated dashboards deliver value only when users embrace them. Invest in comprehensive training programs that demonstrate practical benefits rather than technical features. Gather user feedback continuously and iterate dashboard designs based on real-world usage patterns. Champions within each department can promote adoption by sharing success stories and best practices.
🌟 Emerging Trends Shaping the Future
Real-time dashboard technology continues evolving rapidly as new capabilities emerge and mature. Forward-thinking organizations monitor these trends to maintain competitive advantages.
Artificial Intelligence Integration
AI-powered dashboards move beyond displaying current conditions to predicting future states and recommending optimal actions. Natural language interfaces enable users to ask questions conversationally rather than navigating complex menus. Computer vision analyzes video feeds to automatically detect safety violations, quality defects, or unusual activities.
Augmented Reality Overlays
AR applications superimpose sensor data onto physical equipment through smartphone cameras or smart glasses. Technicians view temperature readings, vibration levels, and maintenance histories while looking directly at machines. This spatial context enhances understanding and accelerates troubleshooting.
Edge Intelligence Expansion
Processing capabilities at the network edge continue increasing, enabling more sophisticated analytics near sensor sources. Edge devices perform real-time video analysis, execute machine learning models, and coordinate responses without requiring cloud connectivity. This architecture reduces latency, conserves bandwidth, and improves reliability.
Digital Twin Integration
Real-time sensor data feeds digital twin simulations that model physical asset behavior. These virtual replicas enable scenario testing, optimization experiments, and operator training without risking actual equipment. Comparisons between predicted and actual sensor readings identify model discrepancies that highlight operational issues.
🎨 Designing Dashboards That Users Actually Love
Technical capability means little if users find dashboards confusing or unhelpful. Design principles focused on human factors create interfaces that people genuinely want to use.
Visual hierarchy guides attention to the most important information first. Use size, color, and position to emphasize critical metrics while keeping supporting details accessible but subordinate. Consistent color schemes help users quickly interpret status—green for normal, yellow for warning, red for critical.
Minimize cognitive load by avoiding cluttered displays packed with competing elements. Each dashboard view should answer specific questions for particular user roles. Drill-down capabilities provide access to detailed data without overwhelming the primary display.
Interactive elements enable exploration and analysis. Users should easily adjust time ranges, compare different sensors, and apply filters to focus on relevant subsets. Hover tooltips provide additional context without permanently consuming screen space.
Performance matters critically for real-time applications. Dashboards must update smoothly without lag or stuttering that destroys the sense of immediate connection to operational reality. Optimize queries, implement efficient rendering, and use progressive loading for complex visualizations.
💰 Calculating Return on Investment
Justifying dashboard investments requires demonstrating tangible financial benefits. ROI calculations should account for both hard savings and softer productivity improvements.
Downtime reduction delivers measurable savings by multiplying prevented outage hours by the cost per hour of lost production. Improved energy efficiency translates directly to utility bill reductions. Quality improvements reduce scrap rates and warranty claims. Maintenance optimization lowers spare parts inventory and reduces emergency repair premiums.
Productivity gains from faster decision-making and reduced information-gathering time represent significant value despite harder quantification. Time-motion studies comparing workflows before and after dashboard deployment can document these improvements.
Risk mitigation through early problem detection prevents catastrophic failures with enormous potential costs. While these avoided disasters don’t appear in accounting records, their probability reduction provides real value in expected cost calculations.

🚦 Taking Your First Steps Toward Real-Time Insights
Organizations ready to harness real-time sensor dashboard power should begin with focused pilot projects that demonstrate value while managing risk and complexity.
Identify a specific problem or opportunity where instant data visibility could drive significant improvement. Choose projects with clear success metrics, manageable scope, and engaged stakeholders. Manufacturing operations might start with monitoring a single production line. Facilities management could begin with energy monitoring in one building.
Assemble cross-functional teams including operations personnel who understand processes, IT professionals managing infrastructure, and data specialists designing analytics. This collaboration ensures dashboards address real needs with technically sound implementations.
Set realistic timelines that account for sensor installation, system configuration, testing, and user training. Rushing deployment creates frustration and undermines adoption. Incremental rollouts allow learning and adjustment before full-scale implementation.
Establish baseline measurements before dashboard deployment to enable clear before-and-after comparisons. Document improvements and share success stories to build momentum for expansion to additional areas.
The transformation enabled by real-time sensor dashboards extends far beyond technology implementation. Organizations gain unprecedented visibility into operations, empowering teams to identify opportunities, solve problems proactively, and optimize performance continuously. As sensor technology becomes increasingly ubiquitous and affordable, the competitive advantage flows to those who can effectively harness the resulting data streams through intelligent real-time visualization. The question is no longer whether to implement sensor dashboards, but how quickly you can deploy them to stay ahead in an increasingly data-driven world.
Toni Santos is a bioacoustic researcher and conservation technologist specializing in the study of animal communication systems, acoustic monitoring infrastructures, and the sonic landscapes embedded in natural ecosystems. Through an interdisciplinary and sensor-focused lens, Toni investigates how wildlife encodes behavior, territory, and survival into the acoustic world — across species, habitats, and conservation challenges. His work is grounded in a fascination with animals not only as lifeforms, but as carriers of acoustic meaning. From endangered vocalizations to soundscape ecology and bioacoustic signal patterns, Toni uncovers the technological and analytical tools through which researchers preserve their understanding of the acoustic unknown. With a background in applied bioacoustics and conservation monitoring, Toni blends signal analysis with field-based research to reveal how sounds are used to track presence, monitor populations, and decode ecological knowledge. As the creative mind behind Nuvtrox, Toni curates indexed communication datasets, sensor-based monitoring studies, and acoustic interpretations that revive the deep ecological ties between fauna, soundscapes, and conservation science. His work is a tribute to: The archived vocal diversity of Animal Communication Indexing The tracked movements of Applied Bioacoustics Tracking The ecological richness of Conservation Soundscapes The layered detection networks of Sensor-based Monitoring Whether you're a bioacoustic analyst, conservation researcher, or curious explorer of acoustic ecology, Toni invites you to explore the hidden signals of wildlife communication — one call, one sensor, one soundscape at a time.


